0
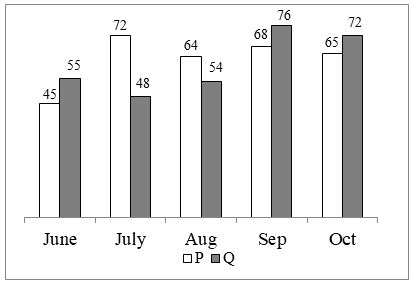
The bar graph given below shows the production of soaps (in thousands) by two companies P and Q from June to October.
Which of the following statement(s) is/are correct?
I. Total number of soaps produced by P in July is 28.5 percent more than Q in that month.
II. Total number of soaps produced by P in August is 18.5 percent more than Q in that month.
III. Total number of soaps produces by P and Q in September is 144000.
Which of the following statement(s) is/are correct?
I. Total number of soaps produced by P in July is 28.5 percent more than Q in that month.
II. Total number of soaps produced by P in August is 18.5 percent more than Q in that month.
III. Total number of soaps produces by P and Q in September is 144000.
- AOnly I
- BII and III
- COnly III
- DOnly II
Correct answer: B