0
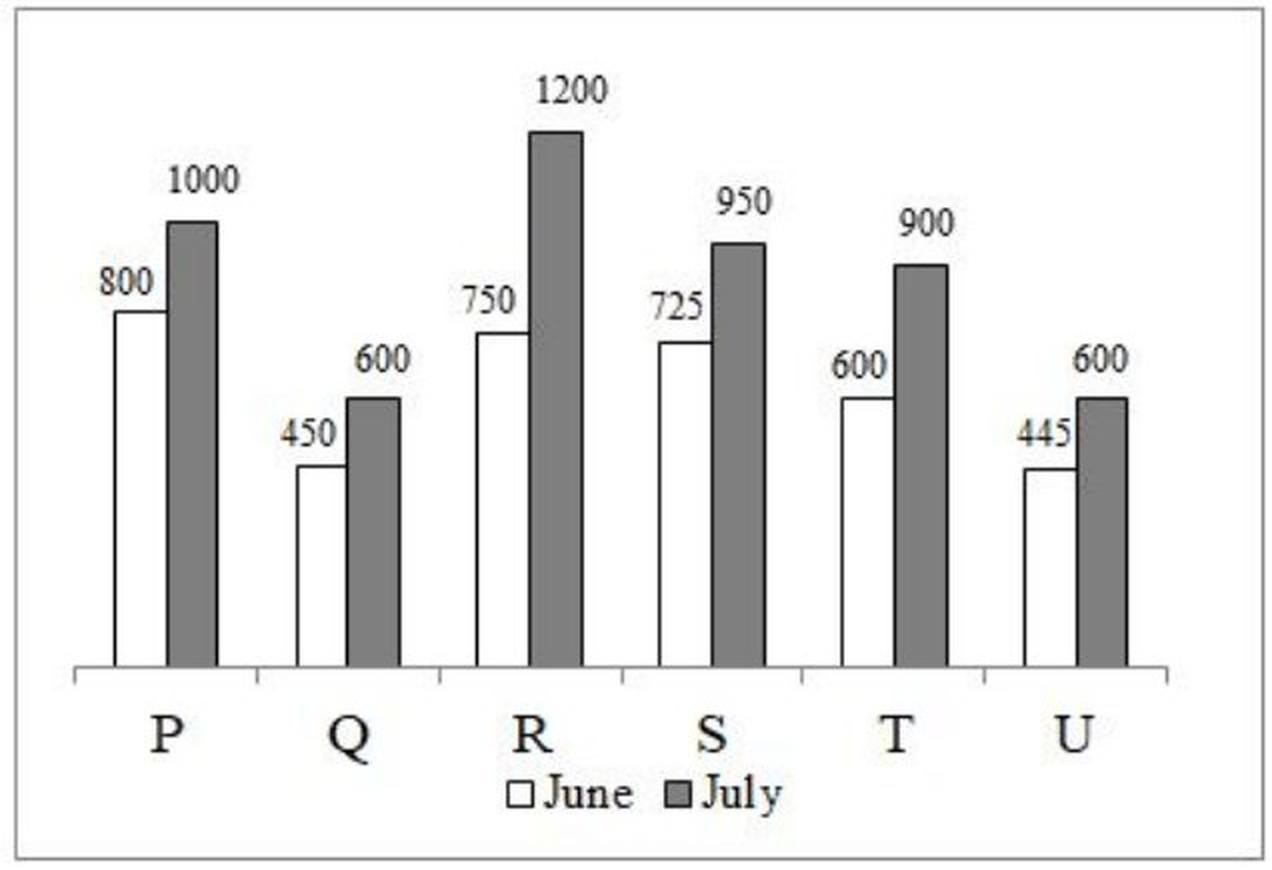
The bar graph given below shows the sales turnover of 6 companies P, Q, R, S, T and U for the month of June and July.
Which of the following statement(s) is/are correct?
I. Company R has the maximum percentage difference in sales turnover between two months.
II. Company T has the maximum percentage difference in sales turnover between two months.
III. Company S has the minimum percentage difference in sales turnover between two months.
- AOnly I
- BII and III
- CI, II and III
- DOnly II
Correct answer: A