0
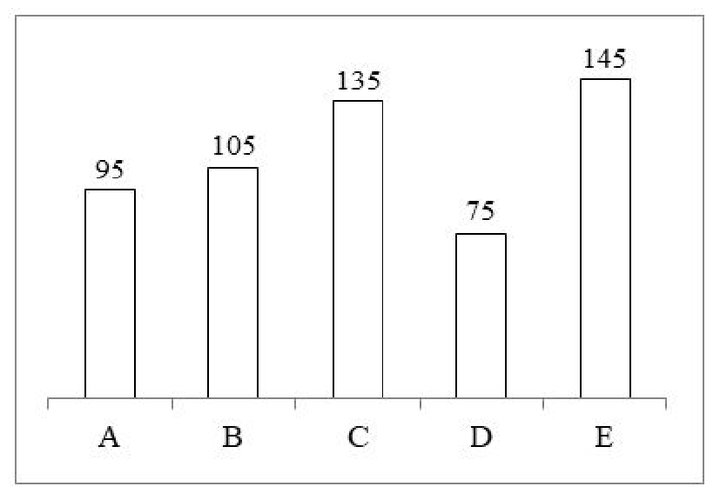
The bar graph given below shows the runs scored by five batsmen in a cricket match.
J1 = Average runs scored by all the five batsmen
J2 = Difference between runs scored by E and D
J3 = Difference between runs scored by C and B
What is the value of (J3 – J2 + J1)?
J1 = Average runs scored by all the five batsmen
J2 = Difference between runs scored by E and D
J3 = Difference between runs scored by C and B
What is the value of (J3 – J2 + J1)?
- A61
- B81
- C71
- D91
Correct answer: C