0
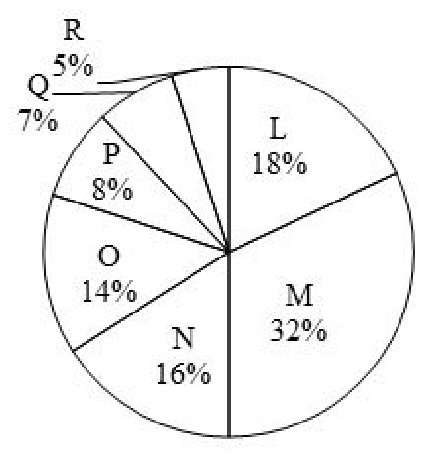
The pie chart given below shows the population of seven states L, M, N, O, P, Q and R.
Total population of all these seven states is 225000. Population of a particular state is shown as a percent of total population of all these seven states.
J1 = Sum of population of state N and O
J2 = Difference between population of state M and N
J3 = Average population of states M, N, O and P
What is the value of (J1 + J2 + J3)?
Total population of all these seven states is 225000. Population of a particular state is shown as a percent of total population of all these seven states.
J1 = Sum of population of state N and O
J2 = Difference between population of state M and N
J3 = Average population of states M, N, O and P
What is the value of (J1 + J2 + J3)?
- A137350
- B142875
- C147350
- D147275
Correct answer: B