0
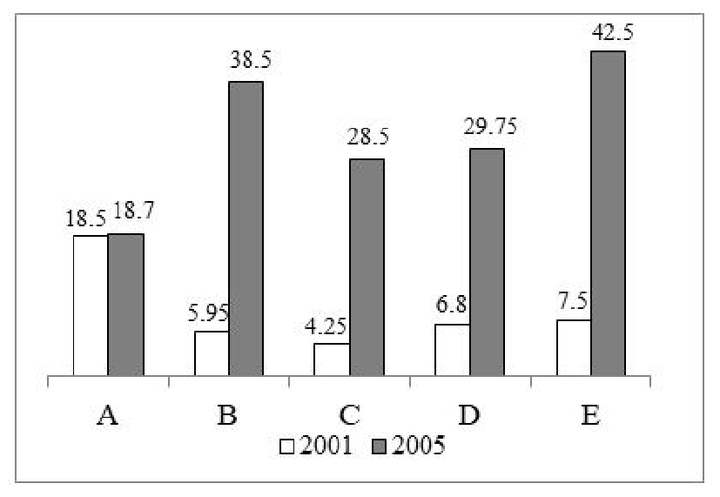
The bar graph given below shows the sales of five different products (in lakhs) A, B, C, D and E during 2001 and 2005 by a company.
Which of the following statement(s) is/are correct?
I. In 2001 Sales of product B is 56.67 percent more than the sales of product C.
II. In 2001 Sales of product A is 146.67 percent more than the sales of product E.
III. Ratio of sales of product C in 2001 to the sales of product D in 2005 is 1 : 7.
Which of the following statement(s) is/are correct?
I. In 2001 Sales of product B is 56.67 percent more than the sales of product C.
II. In 2001 Sales of product A is 146.67 percent more than the sales of product E.
III. Ratio of sales of product C in 2001 to the sales of product D in 2005 is 1 : 7.
- AOnly I
- BBoth II and III
- COnly III
- DOnly II
Correct answer: B