Question discussion

Study the following graph and answer the question.Percentage profit earned by companies A and B during 2017 to 2020Percentage profit = (Inc…

3014Hard DSSSB TGT Computer Science 0 replies 1 views
0

Study the following graph and answer the question.

Percentage profit earned by companies A and B during 2017 to 2020
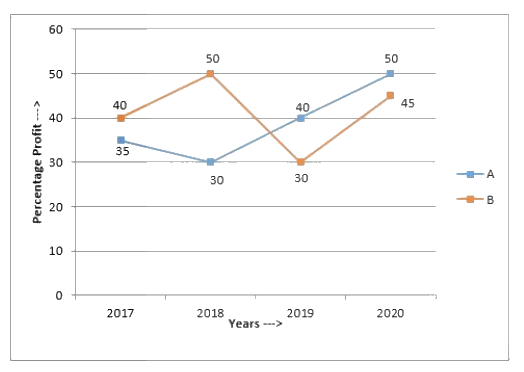
Graph for question 49

Percentage profit = (Income − Expenditure) / Expenditure × 100

Profit = Income − Expenditure

If the total income of both the companies in 2019 was ₹428.8 crores and the ratio of the expenditure of A to that of B in the same year was 2 : 3, then the expenditure (in ₹ crores) of A in that year was:

  • A136
  • B128
  • C124
  • D130
Correct answer: B

Explanation

In 2019 the profit is 40% for A and 30% for B. With expenditures 2k and 3k, incomes are 2.8k and 3.9k, so 6.7k = 428.8 and k = 64. Expenditure of A = 2k = 128 crores.

Discussion 0

Nobody has replied yet. Start the discussion!