Question discussion

The line chart given below shows the production of 6 companies in 2 years P and Q.J1 = The total production of all companies in year P.J2 =…

3408Medium DSSSB TGT Computer Science 0 replies 1 views
0

The line chart given below shows the production of 6 companies in 2 years P and Q.
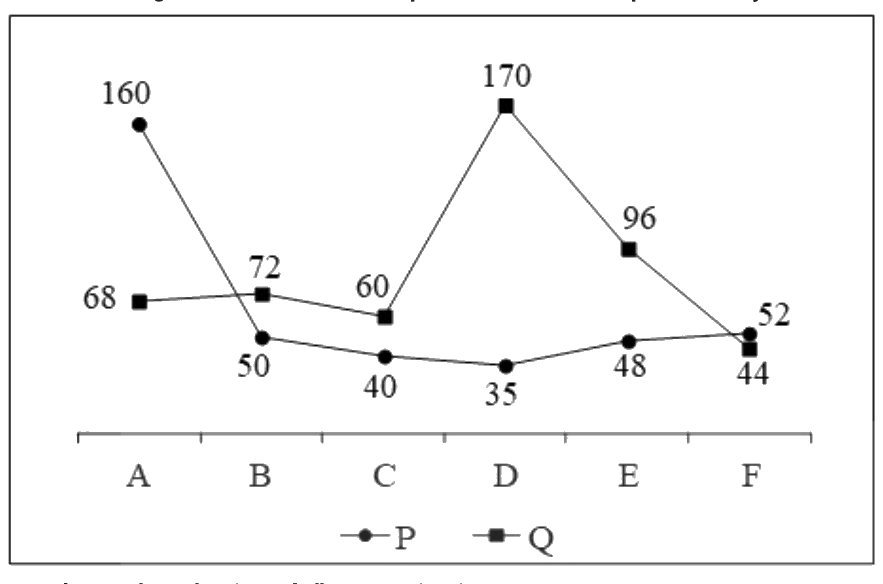
Figure for question 43

J1 = The total production of all companies in year P.

J2 = The total production of all companies in year Q.

What is the value of (J2 – J1)?

  • A125
  • B110
  • C150
  • D85
Correct answer: A

Explanation

Year P total = 160 + 50 + 40 + 35 + 48 + 52 = 385. Year Q total = 68 + 72 + 60 + 170 + 96 + 44 = 510. J2 − J1 = 510 − 385 = 125.

Discussion 0

Nobody has replied yet. Start the discussion!