Question discussion

Study the given graph and answer the following question.Imports and exports of a company in 2017 to 2020 (in ₹ crores)The ratio of the aver…

3610Medium DSSSB TGT Computer Science 0 replies 2 views
0

Study the given graph and answer the following question.

Imports and exports of a company in 2017 to 2020 (in ₹ crores)
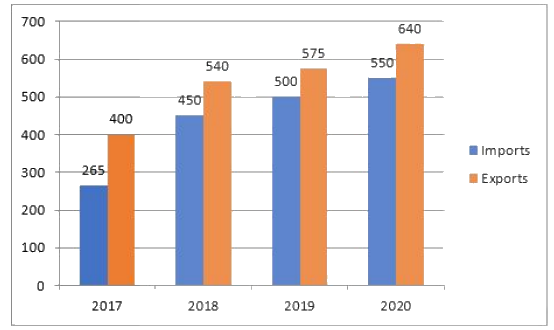
Figure for question 45

The ratio of the average exports of the company in 2018 and 2020 to the total imports in 2017 and 2019 is:

  • A118 : 153
  • B31 : 39
  • C41 : 51
  • D115 : 151
Correct answer: A

Explanation

Average exports of 2018 and 2020 = (540 + 640)/2 = 590. Total imports of 2017 and 2019 = 265 + 500 = 765. Ratio = 590 : 765 = 118 : 153.

Discussion 0

Nobody has replied yet. Start the discussion!